
- ROLE
- Report design, infographics, UI and development, workshop facilitation
- COLLECTIVE
- Swanmakers
- CLIENTS
- WakeUp Capital, ANANDA
// THE BRIEF
Impact reports for WakeUp Capital & ANANDA: layout, infographics and data storytelling for funds and their LPs.
// MISSION LOG
What made this project great.
01
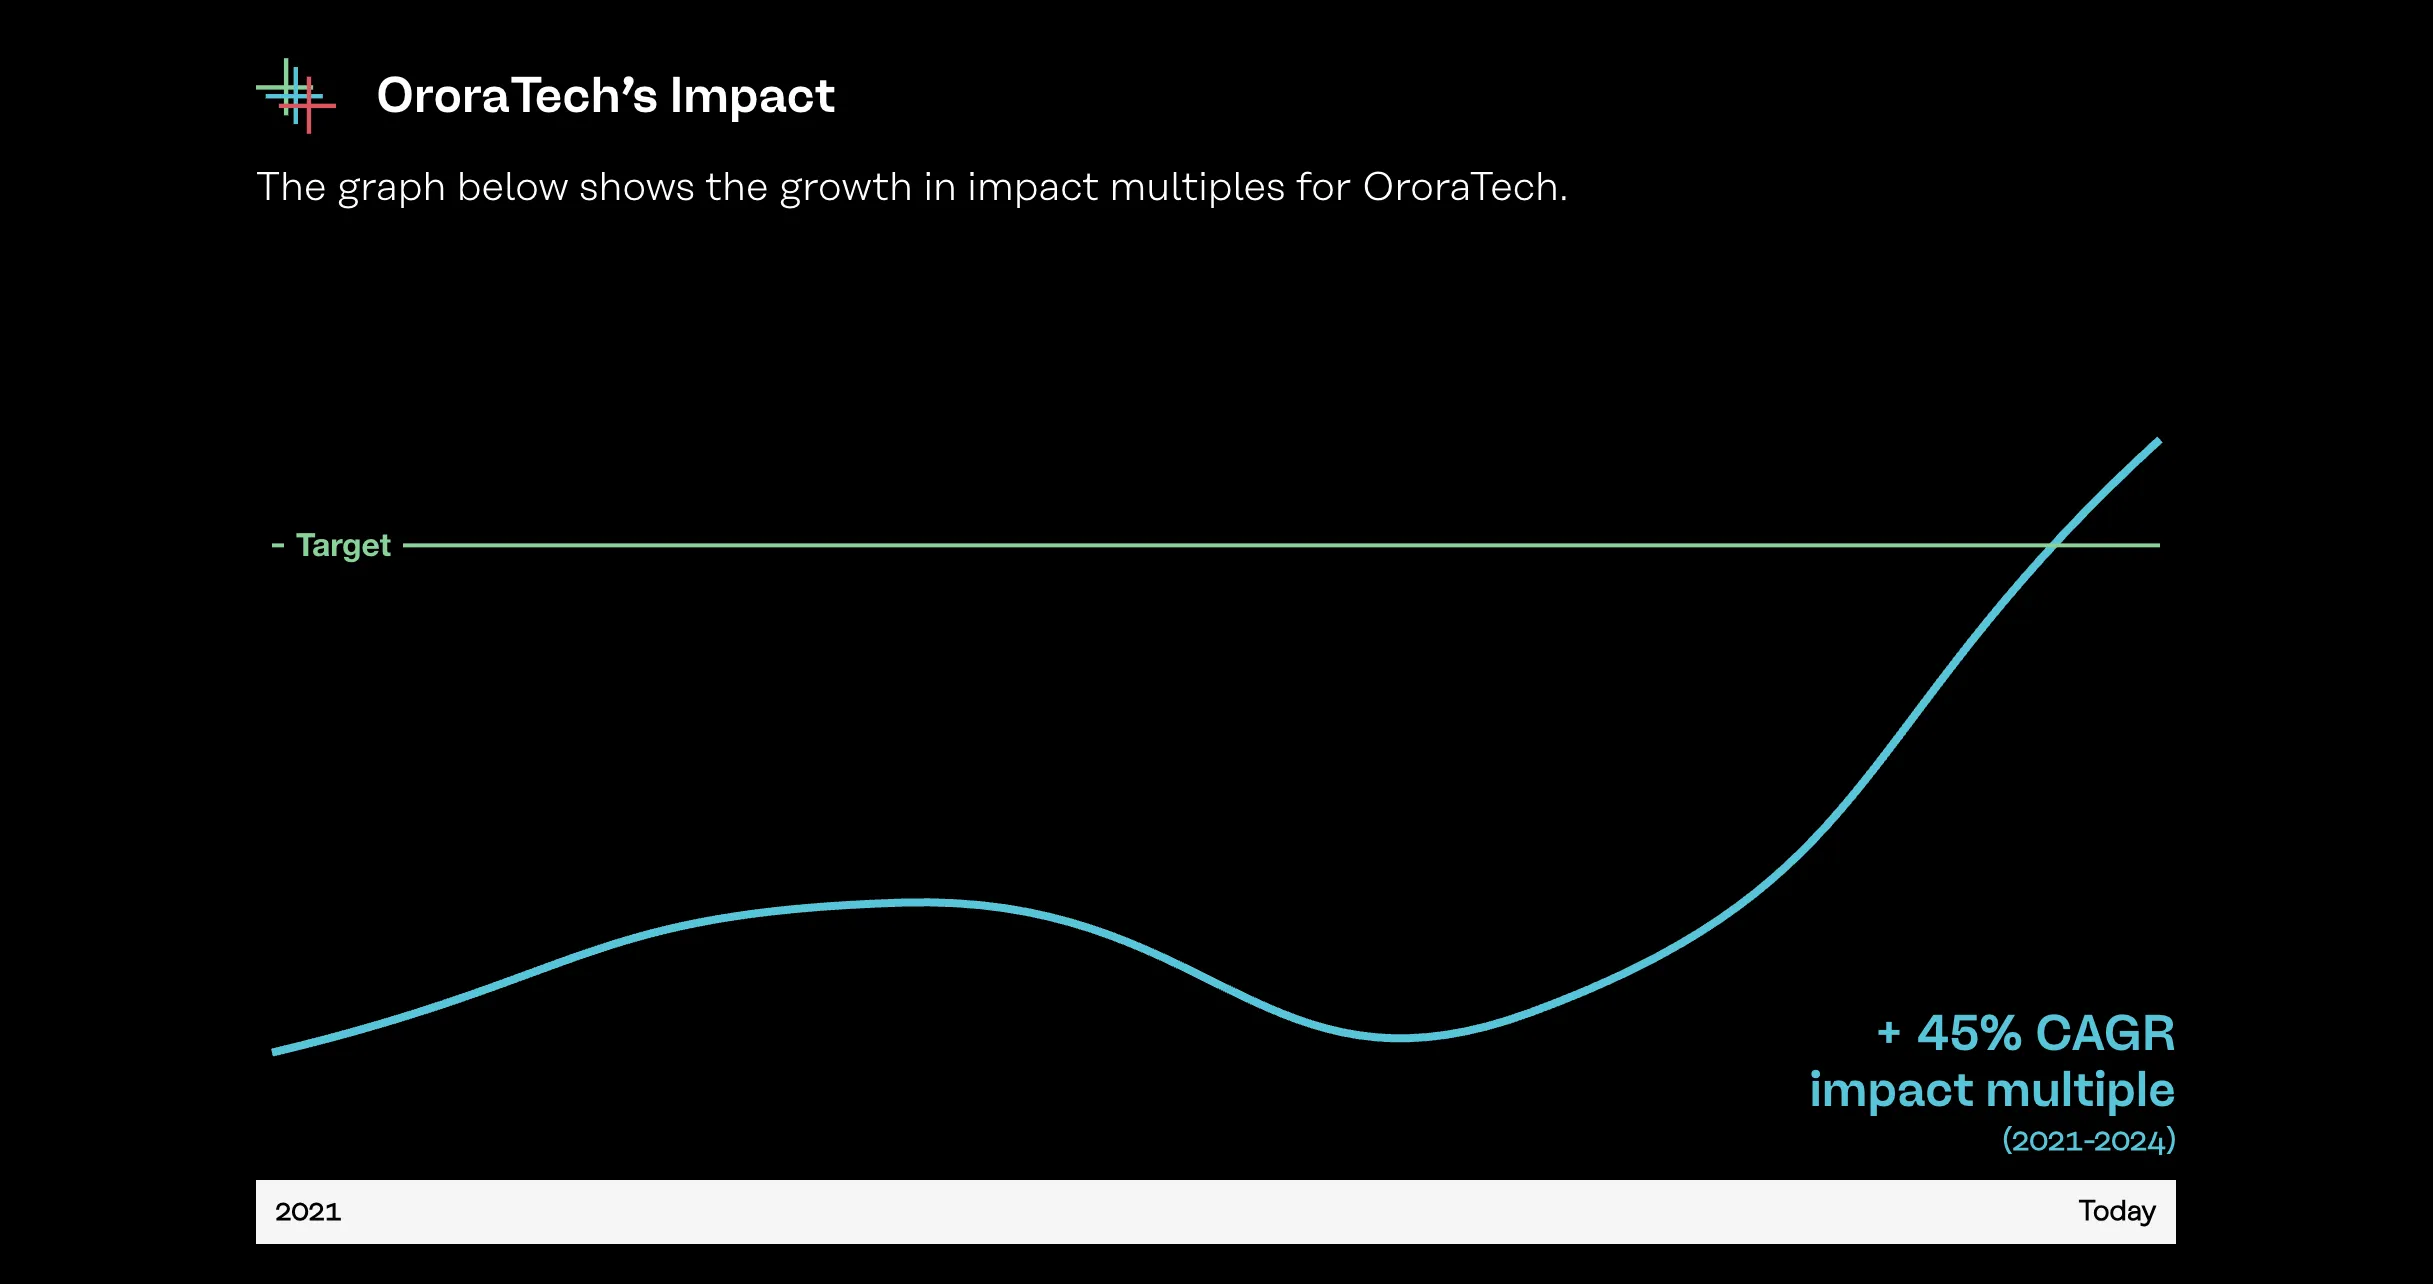
ANANDA: Explaining impact growth and financial returns in one simple graph
In 2024, we proposed an 'impact index'—a unitless number—that could measure both financial performance and impact performance across a range of disparate KPIs. Each company in a portfolio measures very different things. This would be an industry first. In 2026, we developed a graph that did exactly that, while ANANDA was raising its fifth fund.
02
WakeUp Capital: Reporting impact for a young fund
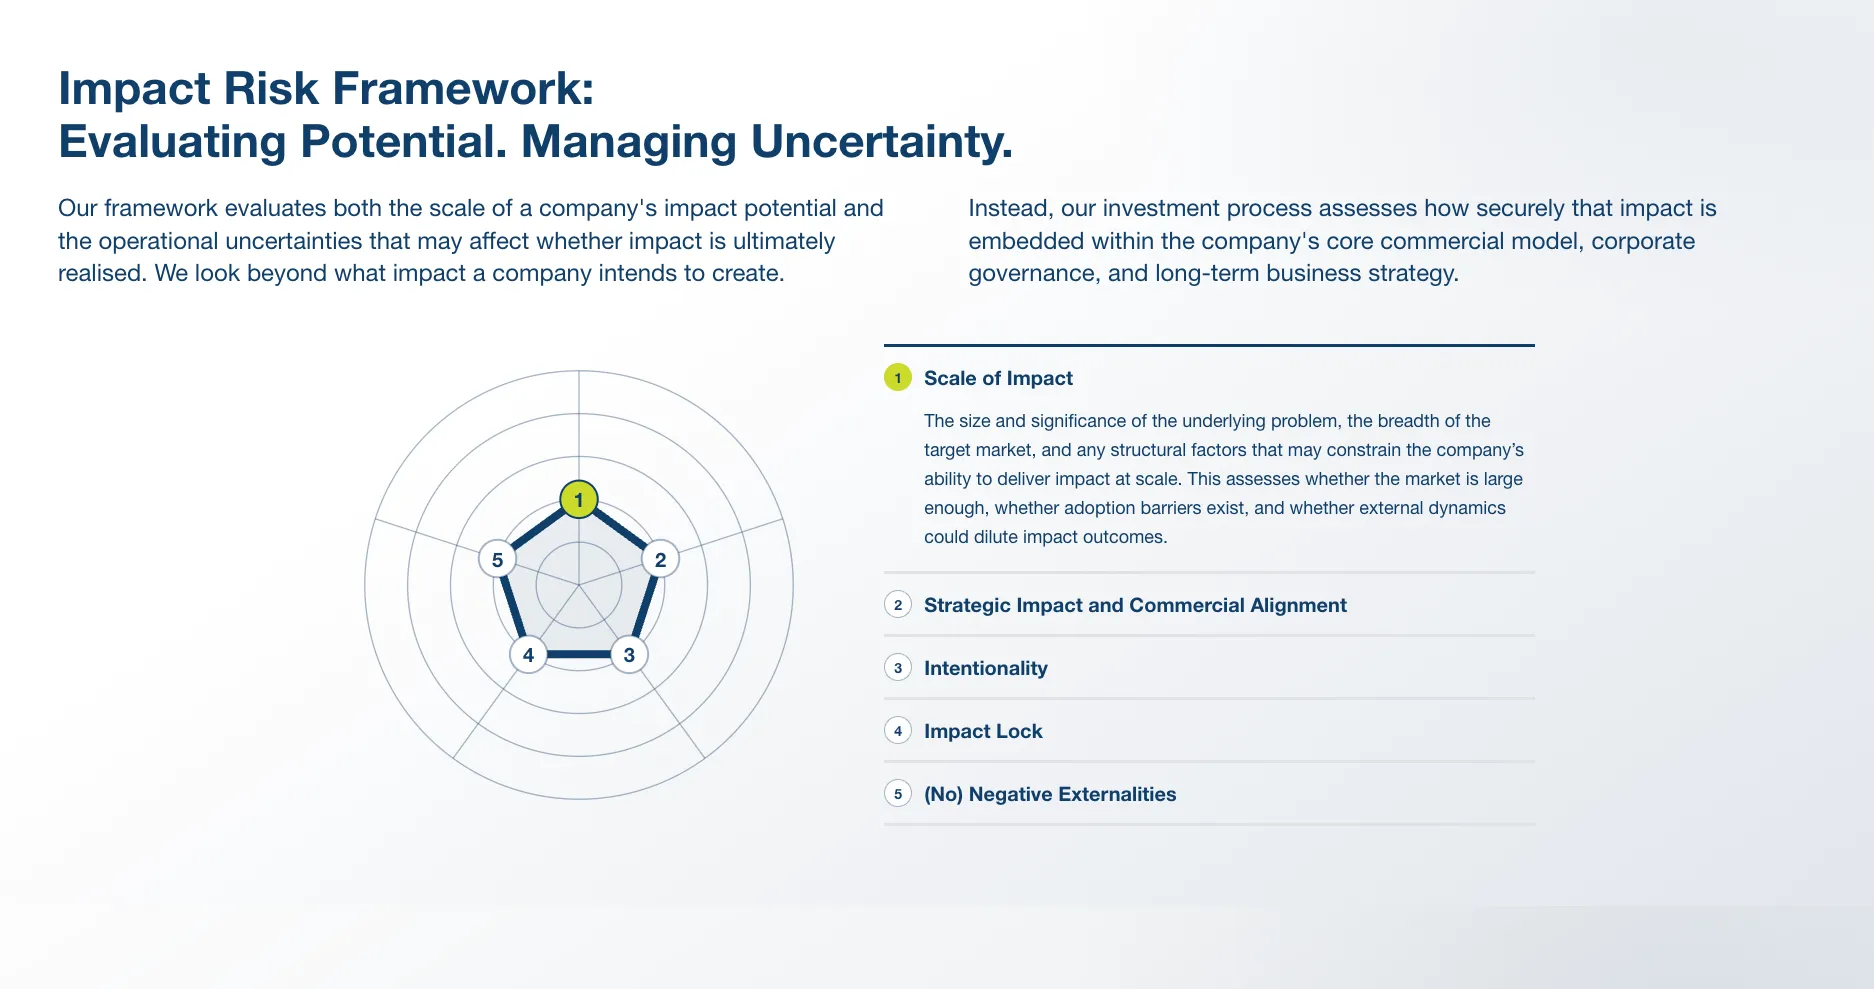
When WakeUp first approached us to develop their first impact report, they were transparent about the challenge: as a young fund, very little historical data could be shown to demonstrate impact from the portfolio companies. We developed a 'Year One' narrative, in which the report sets the baseline and describes their unique approach to constructing an impact framework that can work across a diverse portfolio.
// WAKEUP CAPITAL · ANANDA
Two funds, two ways to show impact.
// MY ROLE
Complex concepts such as measuring positive impact become much more clear when presented in a digestible visual format. My work involves presenting data in a truthful and engaging way. A lot of what goes into a report is thematic and less tangible. I apply a range of techniques, from stylized illustrations to quantifiable infographics, so that the subject matter can be seen and felt by the viewer.
RESPONSIBILITIES
- Strategy workshop facilitation
- Report structure and layout
- Infographics
- UI and web development